Postwatch
Postfix monitoring and management dashboard.
I run three Postfix servers. Checking on them meant three SSH sessions, three mailq calls, and squinting at /var/log/mail.log until something looked wrong enough to care about. So I built a dashboard.
Well. Claude built the dashboard. I did the part that decided whether it would be any good.
There are better ways to monitor mail servers — a postfix exporter into Prometheus, Zabbix, whatever your shop already runs. I know. Postwatch isn't that. It's a small tool that makes something I do every morning a little nicer, and building it turned into the best argument I've seen for vibe coding done right.
The split came first, before a line of code#
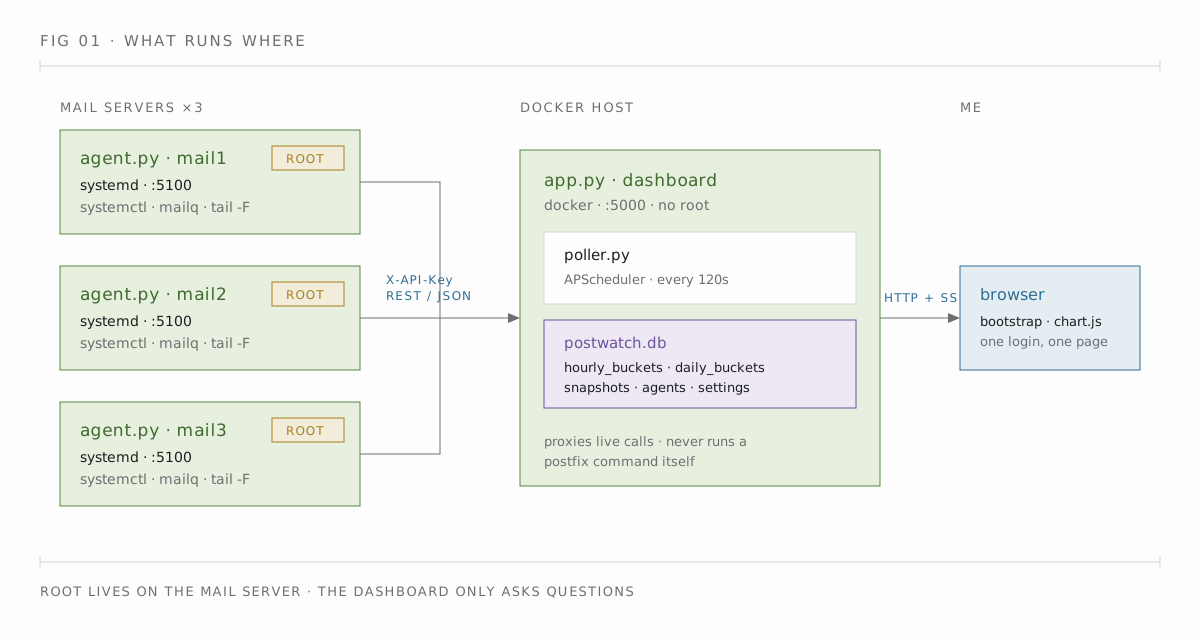
Two components, decided before I opened a prompt: an agent on each mail server, and one central dashboard.
That split isn't cosmetic. The agent has to run systemctl, mailq, postqueue, and tail -F /var/log/mail.log — it lives in systemd, as root, on the mail server, because those commands only work there. The dashboard doesn't need any of that, so it doesn't get any of that. It sits in a Docker container, holds a SQLite file, and asks the agents nice questions over REST with a shared key in an X-API-Key header. Fig. 1 shows the whole shape.
If somebody gets into my dashboard container, they can flush a queue. They can't get a root shell on a mail server. That boundary was mine, and it wasn't up for discussion.
I said no to most of the stack suggestions#
Claude offered an ORM. A build step. A frontend framework. Hashed credentials with multi-user roles. Every one of those is a defensible suggestion in general and the wrong answer for a tool with one user on an internal network.
What shipped instead:
flask
python-dotenv
requests
apscheduler
Four dependencies. That's the entire backend, both halves of it. Bootstrap and Chart.js come off a CDN, the frontend JS is vanilla, and there's no npm, no webpack, no migration framework. SQLite is three tables and some CREATE TABLE IF NOT EXISTS.
The chart lied, and that's where being an admin mattered#
The overview page draws hourly and daily bars. After every dashboard restart, I'd get a huge spike at the start of the current bucket and near-flat bars everywhere else.
It looked plausible. I didn't buy it, so I went and read the actual logs on the actual servers — mail had gone out in a steady dribble all day, no spike, nothing near it. Then I read the poller.
The poller was counting by poll time, not by mail time. The agent parsed the log and handed back totals, and the dashboard filed those totals under "now." Which is fine on the tenth poll and catastrophic on the first: after a restart or a log rotation, that first read swallows the entire in-window log and dumps every message in it into one bucket. The spike wasn't traffic. It was the dashboard's own startup, drawn as mail.
Fig. 2 is the same 24 hours, both ways.
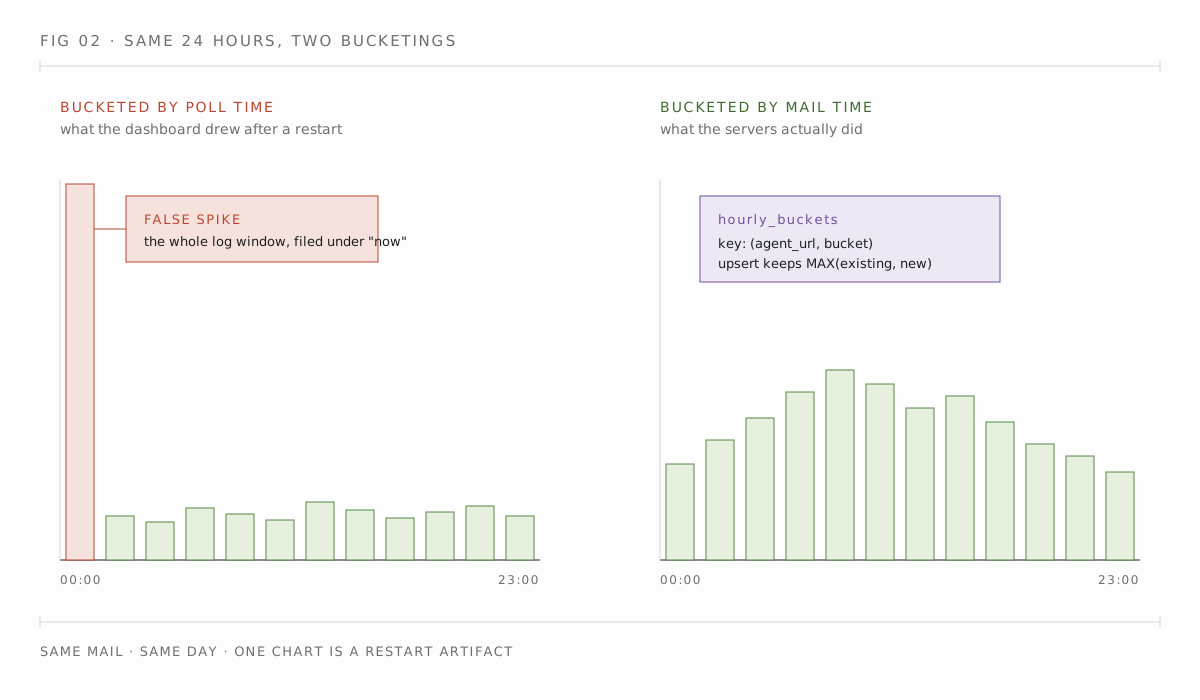
Once I had the diagnosis, Claude and I worked the fix out together, and its suggestion was the better one: stop computing deltas at all. Timestamp every log line at the agent (_parse_log_timestamp handles ISO-8601 and the old BSD syslog format, because Postfix boxes disagree about this), bucket by that timestamp, and persist the buckets with an UPSERT that keeps whichever value is larger.
INSERT INTO hourly_buckets (agent_url, bucket, sent, deferred, bounced, rejected)
VALUES (?, ?, ?, ?, ?, ?)
ON CONFLICT(agent_url, bucket) DO UPDATE SET
    sent     = MAX(sent,     excluded.sent),
    deferred = MAX(deferred, excluded.deferred),
    -- ...
MAX is doing something clever and worth sitting with. A bucket keeps growing while its hour is still fully inside the agent's log window, then freezes at its complete value once those lines rotate off the end. Two polls that see the same log lines can't double-count, and a poll that sees fewer lines can't erase history. No deltas to get wrong. The history outlives the log file.
It's not perfect: buckets from before an agent's first poll never exist, and the oldest hour visible on a first-ever poll can come in light. It was acceptable for my use case. I just need to see if a mail server was backed up or get a general idea of trends.
My skill didn't disappear, it moved#
I barely typed any of Postwatch. I typed decisions, and got to think about the plan.
Which process needs root and which one must never have it. What belongs on the agent's API surface and what's the dashboard's business. What a single shared secret actually buys you and what it doesn't. Whether a number on a chart is plausible given how mail really moves through three relays on a Tuesday.
That last one is the whole article. Claude wrote the poller, the Flask routes, the Jinja templates, and the SSE pipe that carries tail -F all the way to a browser EventSource — fast enough that I never dropped out of design headspace into syntax headspace. But it had no way to know the chart was wrong. It hadn't watched that mail flow for two years. I had.
So if you want to try this: pick the thing you already check by hand every morning. Before you open a prompt, write down the boundaries — what runs where, what has root, what happens when it fails. Then let the model type.
Postwatch at a glance#
| Piece | Runs as | Needs root | Talks to |
|---|---|---|---|
agent.py |
systemd, port 5100 | yes — postfix commands, mail.log | answers the dashboard only |
app.py (dashboard) |
Docker, port 5000 | no | agents over REST, browser over HTTP |
poller.py |
APScheduler, every 120s | no | agents → SQLite buckets |
data/postwatch.db |
SQLite file, volume-mounted | no | buckets, snapshots, settings |
Gotchas:
- Regenerating the API key in Settings breaks every agent until you paste the new key into each
.env. Dashboard first, agents second, or you get a page full of "Auth failed." - Charts read the bucket tables. Stat cards read the agent live. They can legitimately disagree by one poll cycle.
/queue/deleteispostsuper -d ALLwith a confirmation modal in front of it. That's the only thing standing between a bad click and an empty queue.- Agent boxes need the firewall open on 5100 to the dashboard, and nothing else.
Postwatch is on GitHub. It won't replace Prometheus and I'd be embarrassed if it tried. Three servers, one page, one chart I trust - that's all I needed.
The part that stuck with me: the only bug that really mattered was the one no prompt would have surfaced. It needed somebody to look at a graph and say that's not what my mail does.